In Class Use of Devices Versus Printed Material
Stephanie Ptak is an assistant professor at Hankuk University of Foreign Studies in Seoul, South Korea. She has taught English in South Korea and Spain, from elementary school to the university level for over a decade. She is interested in teaching goal-setting in the classroom. Email: ptak@hufs.ac.kr
Abstract
Throughout the past decade, there has been a steep increase of students’ use of tablets and laptops in universities in South Korea. However, research is lacking on the effects of devices versus printed material during discussions with peers. Could the use of devices versus printed material in the conversation classroom affect students’ interactions with their classmates? This research focuses on the use of devices versus printed material in an English conversation course at a university in Seoul. This study delves into students’ perspectives of discussing their homework in class with the use of their device or the printed homework. The findings reveal that about half of the students believe that the use of a device or printed homework has no effect on their conversations. While students describe a vast array of opinions and experiences from these two types of class discussions, there is a clear preference to use devices.
Introduction
Since the introduction of laptops and tablets over a decade ago, students around the world have been using these devices in the classroom in a variety of ways. South Korea, home of tech giants such as Samsung and LG, is no exception, as Korean university students typically use laptops and tablet PCs during class. Due to the COVID 19 Pandemic, university classes across South Korea went online for almost two years, which made it absolutely necessary for university students to use some sort of device in order to complete their coursework. When face-to-face classes resumed, there was a clear increase in students’ use of laptops and tablet PCs in the classroom. In fact, the retention rates of tablet PCs alone among Korean 19 to 29-year-olds from pre-pandemic to 2025 have roughly doubled from 30% to 59% (Gallup Korea, 2020; Gallup Korea, 2025).
In a language learning classroom, students become aware of and practice many important aspects of communication that are not necessarily language-based, such as eye contact and body language. Additionally, paying attention to a partner’s facial expressions can aid in assessing the partner’s understanding and grasp of what the speaker says, thereby helping the speaker to adjust their speaking accordingly, possibly through word choice, speaking speed, or further explanations. In a post-pandemic university classroom, how does the presence and use of a laptop or tablet PC by students while in the midst of communication with partners affect these essential communicative tools? Are the devices aiding in engagement of that task or do they become a source of distraction?
Background
South Korea is a country saturated with technology. It is not rare to see young children walking in the streets of Seoul looking at their smart phone with a smart watch on their wrist as they pass massive curved screens that span from one side of a skyscraper to another. In university classrooms, students use a variety of laptops and tablet PCs to take notes, record lectures, do homework, and so on. In particular, the retention rate of tablet PCs has grown from 30% in 2020 pre-COVID Pandemic to 59% in 2025 amongst the 19 to 29-year-old population. (South Koreans typically enter university as 19-year-old students, but may begin a few years later. Female students may finish university within four years, but it is not uncommon to take more time for a variety of reasons. Male students generally take at least six years to graduate, as many complete their mandatory military service between their first and second year of studies.) Figure 1 shows the growth in the retention rates of notebook computers and tablet PCs in the 19 to 29-year-old population from 2020 pre-pandemic to 2025.
Figure 1
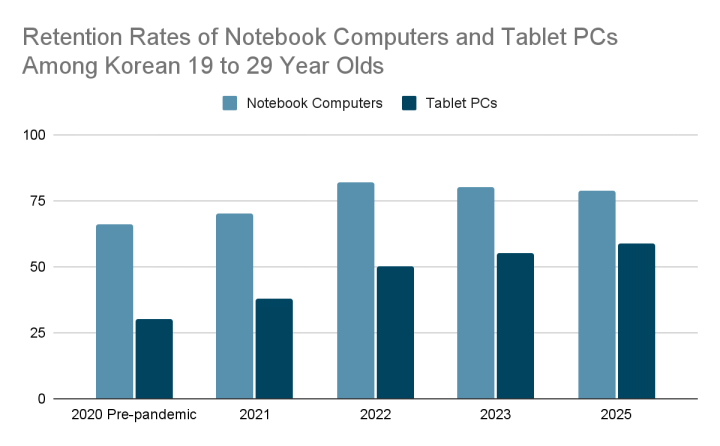
Note. Data adapted from Gallup Korea (2020), Gallup Korea (2021), Gallup Korea (2022), Gallup Korea (2023), and Gallup Korea (2025).
Students use this technology for a variety of reasons and in a variety of ways. “As the use of tablet PCs in the classroom grows, there is a growing need to understand how these various uses and applications can facilitate and enhance student learning” (Enriquez, 2010). As educators, we must not only accept this technology but learn how to “adapt best-practice learning strategies with digital devices to meet the needs” of our learners (Dees et al., 2017). Furthermore, it is our duty to “embrace these technologies as viable tools for academic achievement” (Dees et al., 2017).
Teachers’ and students’ attitude toward technology affects how and if this medium is embraced and used in the classroom. Blackwell (2013) found that teachers’ pedagogical methods have a close connection with their attitudes and beliefs about technology. Dovigo (2021) stated that “personal factors that include one’s own teaching philosophy, perceptions of and convictions about technology, to what extent one feels at ease with it and how much one uses” technology determines teachers’ attitudes. In regards to not only teachers, but learners as well, Musa (2006) states that the value attached to the technology by the individual is crucial to how the medium will be accepted and embraced. Accordingly, teacher and learner attitudes toward various technologies must be studied to efficiently and positively integrate technology into the classroom (Laher & Boshoff, 2017).
Positive Aspects of Laptops and Tablet PCs in the Classroom
Collectively, research reveals a plethora of ways that technology in the classroom is beneficial for students. With the use of a laptop or tablet PC by students, versus working traditionally with paper and pen, research shows that students have “enhanced note-taking ability,” and they are able to organize their material more efficiently due to the integration of notes, voice recordings, and course materials (Enriquez, 2010). A common way that students emulate traditional note-taking with a tablet PC is through the use of the touchscreen as a notepad and the use of a stylus or a finger in lieu of a writing tool (Hye Jeong Kim et al., 2016). This allows students to simply bring their device to class in lieu of bringing a textbook, notebook, recording device, and so on that would be required to mimic all the capabilities of their device.
With the devices' seemingly unlimited capabilities plus the ever-growing number of applications for laptops and tablet PCs, students are able to tailor their studies to ways that suit them. “These features make a tablet PC highly adaptable to individual students' learning strategies (Ellis-Behnke et al. 2003). Students absorb, recall, and produce knowledge in a variety of ways, and this medium allows students the flexibility to employ the methods that best serve them. “Tablet-based interactive classroom technologies have the potential to generate new ways of fostering creative experiences through drawing, seeing, expressing, learning, and engaging with instructional situations” (Hye Jeong Kim et al., 2016). They have seemingly unlimited potential, particularly in terms of flexibility and support to benefit not just mainstream students but also students that may have been underserved in the past (Dees, 2017). Simply put, when students become accustomed to using the devices, they are easy to use, they make learning easier, and they provide easy access to the internet, and therefore easy access to information (Laher & Boshoff, 2017). Additionally, students see that “Research is easier, it is easier to translate words, you can contact teachers when outside of school, and it is easier to receive work” (Laher & Boshoff, 2017).
This technology has also led to new ways for students to collaborate with others while engaging with the course material. Murphy et al. (2019) found that while using specific interactive tools on tablets for scaffolding, the tool actually facilitated creative and productive dialogues amongst pairs of students working together, and they used more academic terms versus groups that were using different websites. Some applications allow students to share their device’s screen with other students’ and the teacher’s screens. This allows students to “brainstorm… solve problems, share ideas and work, and develop solutions” seamlessly which then opens “up new approaches and strategies for cultivating creativity in education” (Hye Jeong Kim et al., 2016).
Negative Aspects of Laptops and Tablet PCs in the Classroom
While some research highlights the positive points of the use of laptops and tablet PCs in the classroom, other studies suggest a more complex view of these mediums. First, by using this technology during class, students inevitably have access to the internet; thus they have access to an incomprehensible amount of information, potentially leading to cognitive load. The use of devices “removes many limitations of print sources, but it requires additional strategies to find reliable and relevant material” (Murphy et al., 2019). The task of using a device versus printed materials is more complicated, as it calls “on learners to mentally move between the elements of the digital inquiry process while also relying on word recognition, fluency, and comprehension strategies gained from print reading experiences” (Dobler, 2015). These mental demands from the use of devices in the classroom may require more from students than using traditional printed materials.
Second, along with the use of tech in the classroom comes a responsibility for students to constantly monitor themselves, as there is potential for quite a bit of distraction. About 12% of students in a study pointed out the distracting aspect of their iPads, and when discussing their desire to stop using the tech, one of the most frequently given reasons was that “the iPad is too distracting” (Laher & Boshoff, 2017). In the same study, about 1% of students “pointed to the iPads creating anti-social tendencies amongst peers” (Laher & Boshoff, 2017). Although this percentage is small, it does reveal that students themselves are aware of this negative aspect of technology. In interviews with educators, many point out their worry over students using devices appropriately in class (Dovigo, 2021).
Methodology
Through quantitative and qualitative methods, this research explores the effects of the use of laptops and tablet PCs on students’ conversations with their peers in a communicative English course that is required at a university in Seoul, Republic of Korea. The participants of this study are about 200 Korean students, and the vast majority of students were in their first year of studies at the time. There was a very small number of upper classmen or students retaking the course, about 1 or 2 students in each of the 8 classes overall. This study took place during two semesters, the 2024 Fall semester and the 2025 Fall semester.
In this communicative English course, there is a large emphasis on sustained discourse with peers. The course meets two times a week, and the first one-hour class is dedicated to the introduction of that week’s topic. After class, students are assigned homework. The homework consists of book work, such as vocabulary activities, listening activities, and reading which all are related to the weekly topic. Additionally, students are asked to answer eight to ten questions pertaining to the book topic, or less questions with a short writing assignment. The second class of the week meets for two hours, and students are required to bring their homework to class. This homework is essential, as students will then discuss their answers and the book topics with their partners or teams for roughly over an hour, and groups change every ten to fifteen minutes, depending on group size. The homework allows students to prepare for speaking outside of class, giving them time to find any necessary vocabulary and formulate their ideas and opinions before being asked to talk about it at length with partners. For the first half of the semester, two of the classes were required to print their homework for the discussion, and the other two could use their tablet PCs or laptops with their homework open on the screen. For the second half of the semester, the requirements were switched. In this way, students experienced discussing their homework with only their paper homework on their desk or with the device with all its capabilities open on their desk. For the first class when students were allowed to use a device to access the homework, 100% of students used a tablet PC or a laptop in class, showing that every single student had access to one of the two devices in order to produce their homework in class. Lastly, students do not have access to their phones during class, as their phones are collected at the beginning of every class in order to take attendance.
Table 1: Research Design
|
|
Group AB |
Group CD |
|
Pre-Midterm |
Printed Homework |
Device |
|
Post-Midterm |
Device |
Printed Homework |
At the beginning of the two semesters, students were asked to fill out a survey in order to gauge their current beliefs about how their devices affect their English conversations in a classroom. For the pre-survey, 189 students overall took the survey. Students were also surveyed in the middle of the semester before their homework requirements were switched, and 208 students took that survey. The students were surveyed for a final time at the end of the semester after experiencing discussion classes with paper homework and homework on their devices, and 200 students took the final survey. In the final survey, students were also asked open-ended questions in order to paint a more colorful picture of their experiences and beliefs around English discussions with a device and without a device present. Due to the nature of open-ended questions, students often wrote more than one idea. Therefore, when presenting the data below, some of the percentages overlap, resulting in seemingly more than one hundred percent.
Results & Analysis
The students were asked the three same questions on the pre-survey, midterm survey, and the final survey, with only slight changes in wording due to the surveys being administered before, during, and after the events that were being monitored. Each question had a set of five answers on a Likert scale ranging from 1 representing a strong opinion in favor of printing the homework, 3 representing a neutral opinion, and 5 representing a strong opinion in favor of using a tablet PC or a laptop to view the homework during discussion classes. In the final survey, students were asked to elaborate on their responses to each of these three questions.
Convenience
The first question asked the students about their opinions related to the convenience of bringing the homework to class. On the pre-survey, the average score was 4.5 for Group AB and Group CD, which reveals that students overwhelmingly thought that using the device with the homework would be the most convenient. In the midterm survey, the half of students that had printed the homework for the first half of the semester, Group AB, had a slight reduction in their average score, and the results were an average of 3.9; For the students who used their devices in the first half, Group CD, their score slightly increased to 4.6. In the final survey, group AB had an average score of 4.4, and CD had an average of 4.1. This shows that both groups had a slight reduction in their belief that it would be the most convenient to use their device in class for the homework after experiencing both ways, but their score did not come to the same level as the pre-survey score of 4.5. Figure 1 and Figure 2 show the results of the surveys for Group AB and Group CD respectively throughout the semester. Through these two charts, the influence of their recent activity can be seen more clearly. After using the paper the scores shifted more in favor of the paper homework, while after using their devices the score shifted back to a preference for the devices.
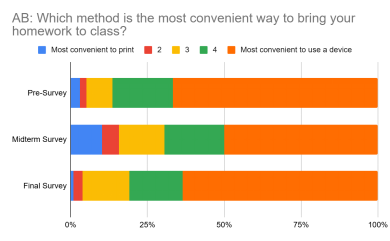
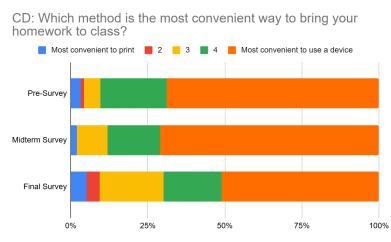
In the final survey, students were asked to elaborate on their response. When separating these responses into themes, the largest group, about 65% of responses, mentioned that printing costs money. Many students said they do not have printers at home, which means they need to go to a print cafe, wait in line, and pay to print each week. A few responses added that this is not just inconvenient, but it actively caused them stress each week. The next largest theme, about 18% of students, was a response of no difference in the convenience of bringing their device or printing their homework. This open-ended question pertained to the convenience of bringing the homework to class, but 13% of students mentioned concentration and distraction in their response. This 13% said that printing the homework improved their concentration, had less distractions, and made it easier to look at their partners’ work when discussing. Overall, these responses said that printing the homework helped with focus despite the inconvenience of printing. Another 13% of responses said they had no opinion.
Speaking More with Partners
The second question asked students about which homework method allows them to speak more with their partners. In the pre-survey, the average score was 4.1 with a preference towards the use of a device. Group AB who used printed homework in the first half of the semester dropped to 3.2 on the midterm survey, while Group CD which used devices gave the overall same opinion of 4.1. On the final survey, Group AB slightly rose to 3.3, and Group CD dropped almost a full point to 3.2 after using printed homework for the second half of the semester. Figure 4 and Figure 5 show the proportions of students who rated at each score. This reveals that similar to the previous question, students’ recent activity influenced their opinion. After Group AB used printed homework, less than 25% of students chose the strong device option, and the percent of students who chose the strong printed option grew from 2% to 14%. Group CD saw a slightly lower increase from the Midterm Survey to the Final Survey after using printed homework, with the strong printed option growing from 4% to 8%. Lastly, both groups of students overwhelmingly changed their strong opinions in favor of the device to a more neutral opinion that both methods allowed them to speak the same amount.
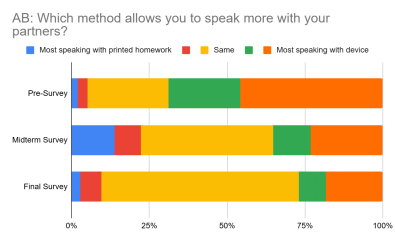
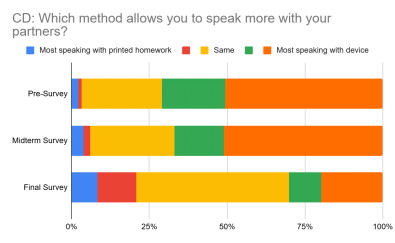
Students were asked to elaborate on their responses on the final survey. About 60% of responses mentioned there was no difference in how much they spoke between the two methods. 20% of responses mentioned that they spoke more with the device due to the comfort they felt using the device, and they were able to search for needed vocabulary during the discussion. 13% of responses said that printed homework allowed them to focus more on the homework questions with less distractions, and they could speak a bit more seriously on the homework topic, rather than going off topic. In 10% of the responses, students said that using a device or printed homework was not important to how much they spoke, rather their partner was more important. They mentioned that the discussion quality was much more dependent on their level of comfort with their partners and their partners’ attitudes. A small group, 6% of responses, highlighted their concerns with devices, such as notifications, social media, and multitasking.
Better Conversation Skills
The third question on the survey related to having better conversational skills with partners, and examples were given, such as eye contact and gestures. On the pre-survey, the average response was 3.8 leaning towards the use of a device allowing for better conversation skills. On the midterm survey, Group AB slightly dipped to 3.2 after using the printed homework, and Group CD went up to 4 after using their devices. In the final survey, Group AB, who had just used their devices in the second half of the semester, had the same score as the midterm survey of 3.2. Group CD, who went up to 4 on the midterm survey, dropped almost a full point to 3.1. Figure 6 and Figure 7 show the students' responses visually. From the beginning of the semester to the end, students who chose 4 or 5 on the survey in favor of the device from Group AB dropped from 64% to 24% and from Group CD dropped from 55% to 26%. On the other end of the scale, students who chose 1 or 2 in favor of printed homework in Group AB rose from 7% to 13%, and Group CD rose from 14% to 24%.
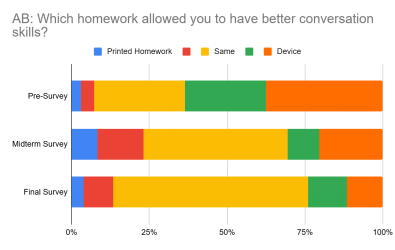
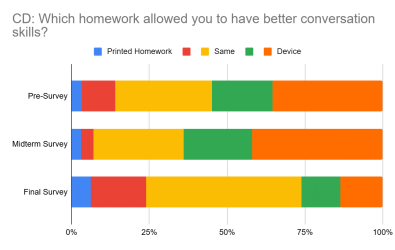
When students were asked to elaborate on their responses, 58% said there was no difference in their conversation skills. 19% stated the device was better for conversation skills, and 12% stated the printed homework was better for conversation skills. Many responses revealed that the device functions as a linguistic and cognitive support tool for the students, particularly for topic expansion and vocabulary gaps. The idea that partners are more important also emerged from these responses, with 13% of responses mentioning this. Distractions from devices were mentioned in 6% of responses. Similar to opinions mentioned earlier, students elaborated here on the idea that the format of the homework shaped the type of conversation. Printed homework led to a more homework focused conversation that was structured around the homework questions. When students used their devices for the discussion, there was more topic expansion, personal talk, and more spontaneous discussions.
Distractions
The fourth and final open ended question on the survey asked about students’ experiences with distractions from devices. Almost half of the responses, 48%, said there were no problems. 29% of responses highlighted a common opinion that rather than distracting students, the device was helpful because students could use it to look up needed vocabulary, search for information or images, and show examples to their partners. 17% of responses mentioned briefly checking social media, but they stressed it was just a few times. Only 6% of responses outright said that the device was distracting, as they saw students playing games or watching youtube which led to a loss of focus and a disruption to the conversation.
Discussion & Conclusion
There are a number of limitations to this research. The first revealed itself as the semester progressed. It became apparent that students may have believed they were voting on how the homework would be submitted in class on the pre-survey. Therefore, this may have drastically shifted students' choices on the scale because they were hoping to not print their homework. Therefore, in the future this needs to be taken into consideration when creating questions for a survey and how they are presented to students. The second limitation is that these results are all self-reported. When students are considering how much they spoke or how well they used conversation skills over a number of weeks, it may be difficult to actually recall how they behaved in class. Even though these limitations exist, there is still quite a large amount of information that can be helpful for educators.
Throughout this research, students shared a vast array of opinions regarding the use of their devices or printed homework in class. As an educator, one of the biggest takeaways from this research is that students need to have an array of experiences and different ways of practicing and interacting with peers in order to determine for themselves what works best. Just as in Laher & Boshoff’s (2017) study, there was a small number of students who felt distracted by the device. The strong conviction that the device would be best for these students certainly weaned for some as the semester passed. The technology is here, and we must accept it. As educators however, it is our duty to guide students to find the best methods for their success.
References
Blackwell, C. (2013), “Teacher practices with mobile technology: integrating tablet computers into the early childhood classroom”. Journal of Education Research, vol. 7, no. 4, pp. 1-25.
Dees, L., LaCour, M., & Lockwood, R. (2017). Exploring Teachers’ Use of Tablet Technology in the Classroom: Tools for Motivating At-risk Learners. International Journal of Technologies in Learning, 24(2), 1–9. https://doi.org/10.18848/2327-0144/cgp/v24i02/1-9
Dobler, E. (2015). e-Textbooks: A PERSONALIZED LEARNING EXPERIENCE OR A DIGITAL DISTRACTION? Journal of Adolescent & Adult Literacy, 58(6), 482–491. http://www.jstor.org/stable/44009184
Dovigo, F. (2021). The role of teachers’ attitude towards the use of the tablet in the first-grade elementary classroom. International Journal of Education & Development Using Information & Communication Technology, 17(3), 234–248.
Ellis-Behnke, R.,J.Gilliland, G. E. Schneider, & D. Singer. 2003. Educational benefits of a paperless classroom utilizing tablet PCs. Cambridge, MA: Massachusetts Institute ofTechnology.
Enriquez, A. G. (2010). Enhancing Student Performance Using Tablet Computers. College Teaching, 58(3), 77–84. http://www.jstor.org/stable/41305089
Gallup Korea. (2020, February 14). 정보통신·자동차 관련 제품 12종 보유율 (팬데믹 이전) [Possession rate of 12 types of information and communication and automobile-related products (Pre-pandemic)].
https://www.gallup.co.kr/gallupdb/reportContent.asp?seqNo=1119
Gallup Korea. (2021, March 18). 정보통신·자동차 관련 제품 12종 보유율 [Possession rate of 12 types of information and communication and automobile-related products].
https://www.gallup.co.kr/gallupdb/reportContent.asp?seqNo=1215
Gallup Korea. (2022, July 4). 생활·정보 가전, 자동차 등 20종 보유율, 반려동물 동거율 [Household ownership rates of 20 types of consumer and information appliances and pet-keeping rates].
https://www.gallup.co.kr/gallupdb/reportContent.asp?seqNo=1333
Gallup Korea. (2023, August 3). 생활·정보 가전, 자동차 등 20종 보유율, 반려동물 동거율 [Household ownership rates of 20 types of consumer and information appliances and pet-keeping rates].
https://www.gallup.co.kr/gallupdb/reportContent.asp?seqNo=1439
Gallup Korea. (2025, November 20). 생활·정보 가전, 자동차 등 20종 보유율, 반려동물 동거율 [Household ownership rates of 20 types of consumer and information appliances and pet-keeping rates]. https://www.gallup.co.kr/gallupdb/reportContent.asp?seqNo=1597
Hye Jeong Kim, Ji Hyeon Park, Sungae Yoo, & Hyeoncheol Kim. (2016). Fostering Creativity in Tablet-Based Interactive Classrooms. Educational Technology & Society, 19(3), 207–220.
Laher, S., & Boshoff, E. (2017). Understanding learner attitudes towards the use of tablets in a blended learning classroom. Perspectives in Education, 35(1), 200–213. https://doi.org/10.18820/2519593X/pie.v35i1.15
Murphy, V. L., Coiro, J., & Kiili, C. (2019). Exploring Patterns in Student Dialogue While Using a Digital Platform Designed to Support Online Inquiry. Journal of Interactive Media in Education, 2019(1), 1–13. https://doi.org/10.5334/jime.518
Musa, P.F. 2006. Making a case for modifying the technology acceptance model to account for limited accessibility in developing countries. Information Technology for Development, 12. https://doi.org/10.1002/itdj.20043
Coming soon! Please check the Pilgrims in Teacher Training courses in 2027 at Pilgrims website
In Class Use of Devices Versus Printed Material
Stephanie Ptak, South KoreaDeveloping AI literacy in Language Teacher Training
Anna Turula, Poland